
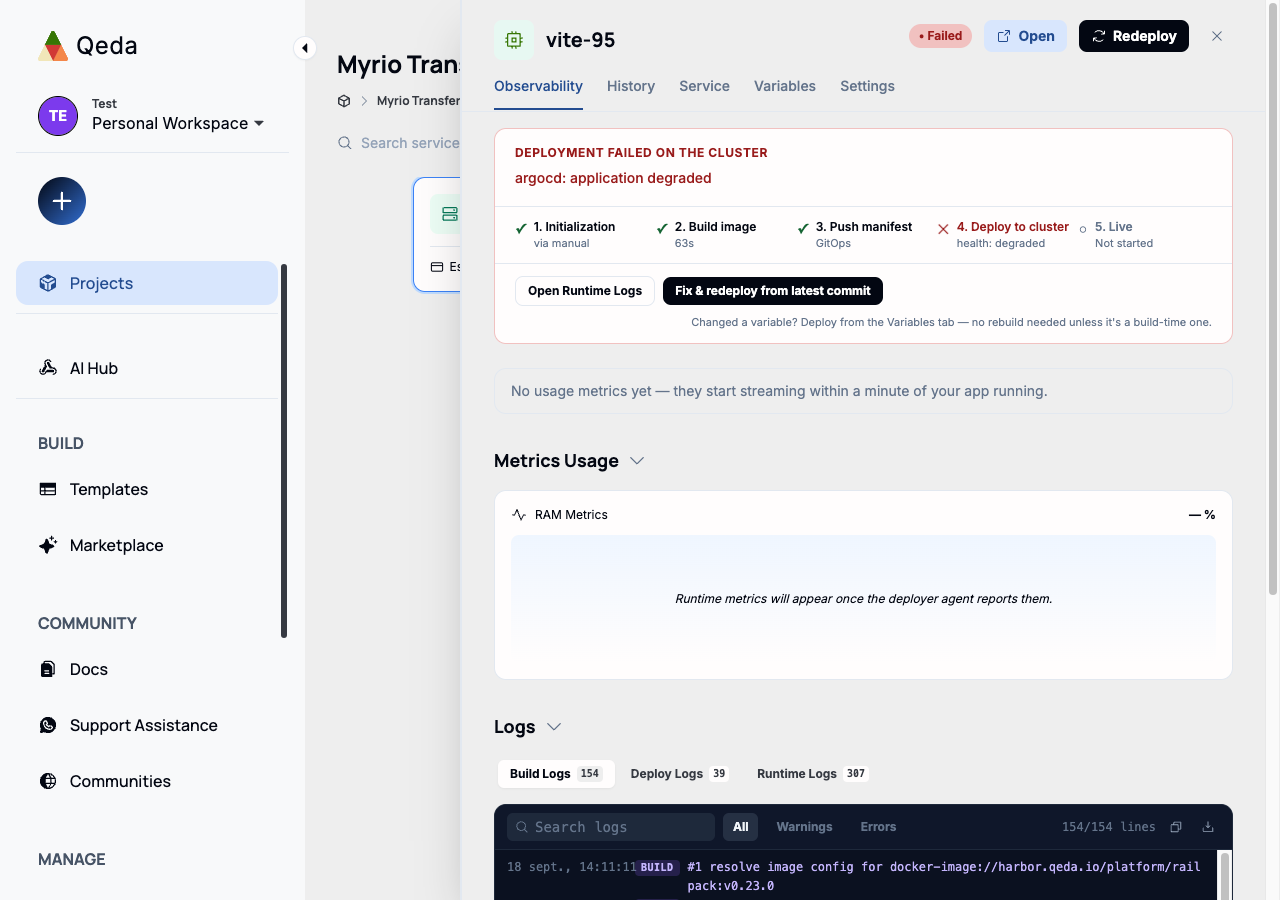
Click any card on a project's canvas — app or companion — to open its detail panel. It opens on the Observability tab, which is where a deploy's status, its pipeline, and its logs all live.
When a deploy is still going or hits a problem, the top of the tab shows a 5-step pipeline (Initialization, Build image, Push manifest, Deploy to cluster, Live) with a check or a cross on each step, plus a one-line reason when one fails. From there, "Fix & redeploy from the latest commit" re-runs the pipeline without leaving the panel — useful after pushing a fix, since most config changes don't need a full rebuild.
Build, Deploy, and Runtime logs
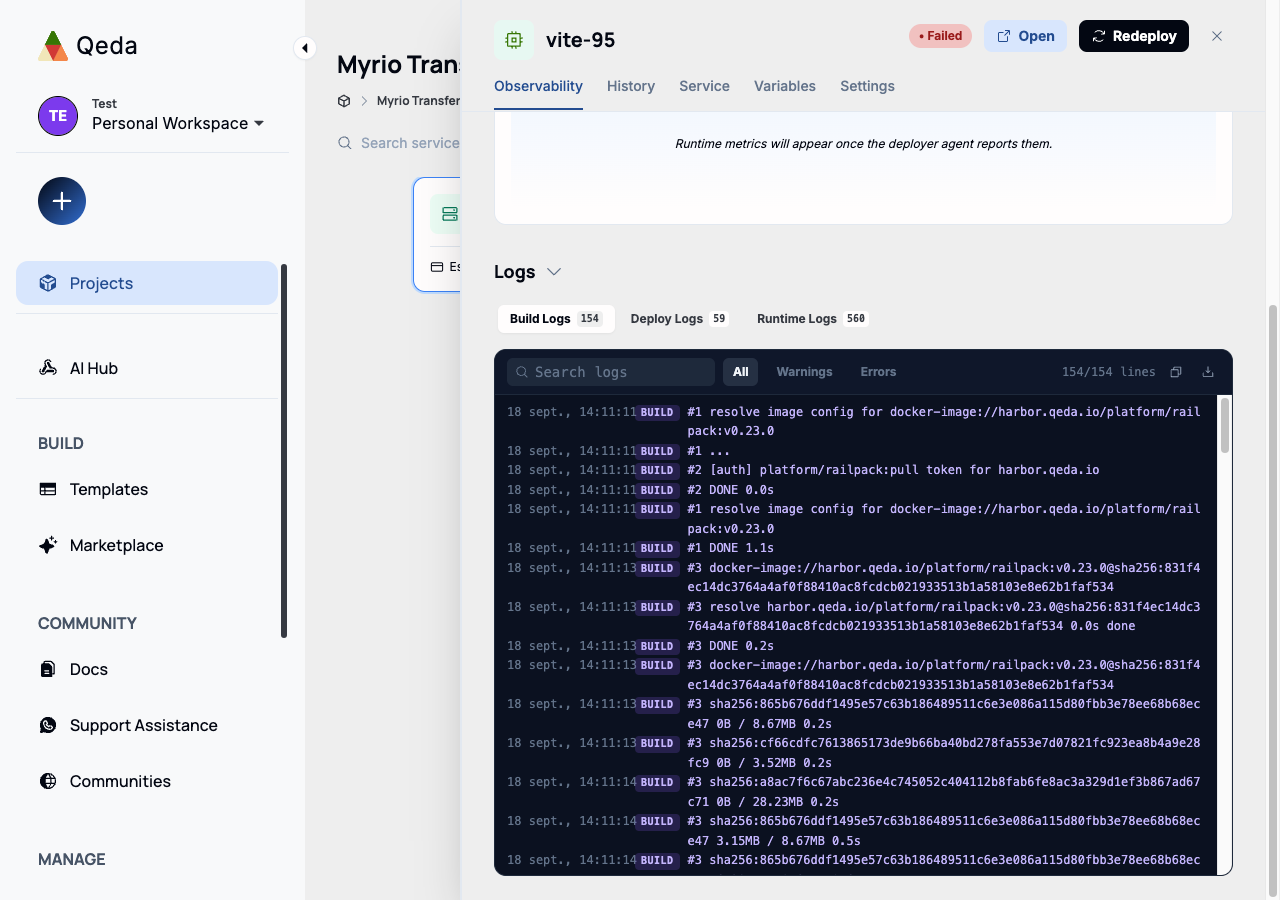
Scrolling down past the metrics, the Logs panel splits into three tabs, each with its own line count: Build Logs (the buildpack or Docker build output), Deploy Logs (what happened pushing the image and manifest to the cluster), and Runtime Logs (what the running container itself prints to stdout/stderr). A "live" indicator on Runtime Logs means it's tailing in real time, not a static snapshot.
Searching and filtering
The search box filters whichever tab is open to matching lines only — useful once a log passes a few hundred lines. Next to it, All / Warnings / Errors narrows by level without typing anything; the line count on the right updates to reflect the active filter. The copy and download icons grab the currently-filtered view, not always the full log.
Note. Runtime Logs only exist once a container has actually started — a build that fails before that point will only ever have Build (and maybe Deploy) logs to show.