
Everything on Qeda starts with a project, and every project needs at least one service to actually do something. This walks through the whole path — from a blank Projects page to a running build — using the Git deploy flow, the fastest way to get your first app live.
Create a project
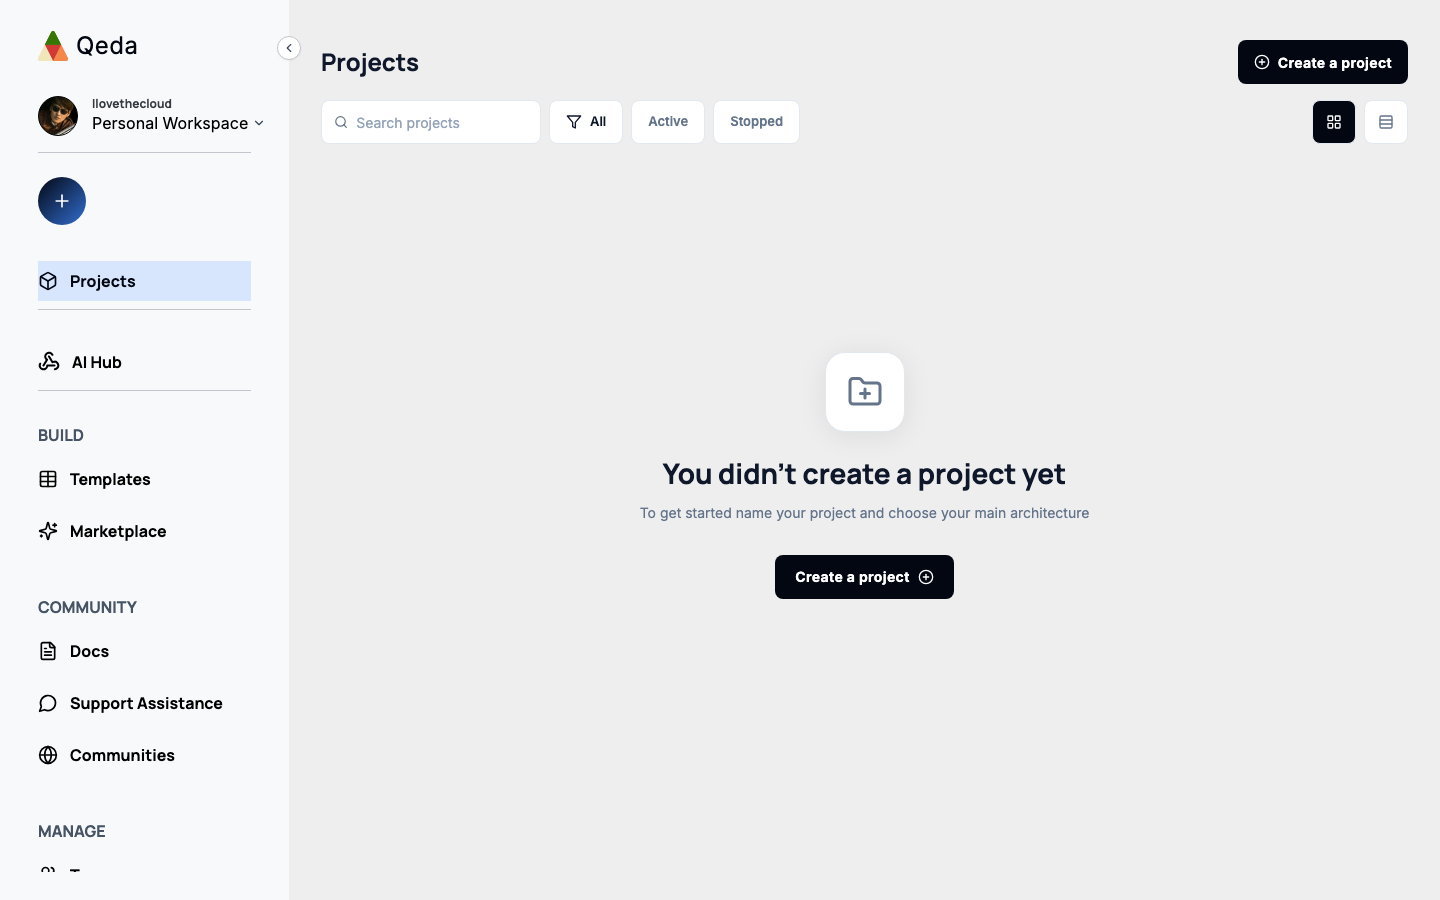
From the Projects page, click "Create a project." You only need a name — description and adding other users to the project are both optional and can be filled in later.
Choose how to deploy
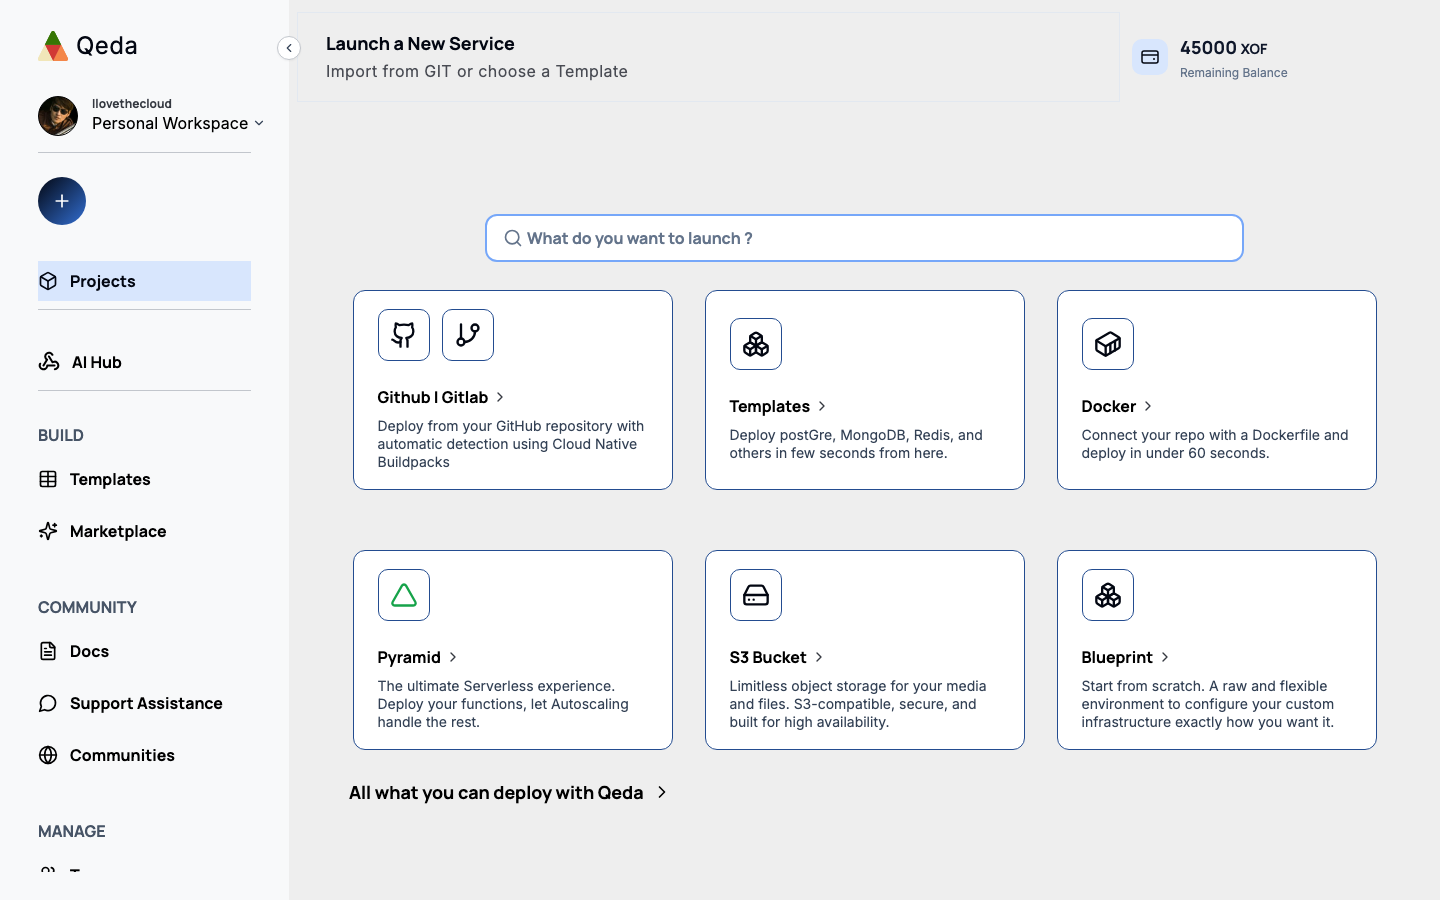
Opening a project for the first time takes you to "Launch a New Service" — every way to get infrastructure running on Qeda, in one screen:
- GitHub | GitLab — deploy from a repository with automatic stack detection via Cloud Native Buildpacks.
- Templates — Postgres, MongoDB, Redis, and other ready-made stacks deployed in a few seconds.
- Docker — connect a repo that already has a Dockerfile.
- Pyramid — the serverless option: deploy functions and let autoscaling handle the rest.
- S3 Bucket — S3-compatible object storage for media and files.
- Blueprint — a blank, fully custom environment if you want to configure everything yourself.
Deploy from GitHub
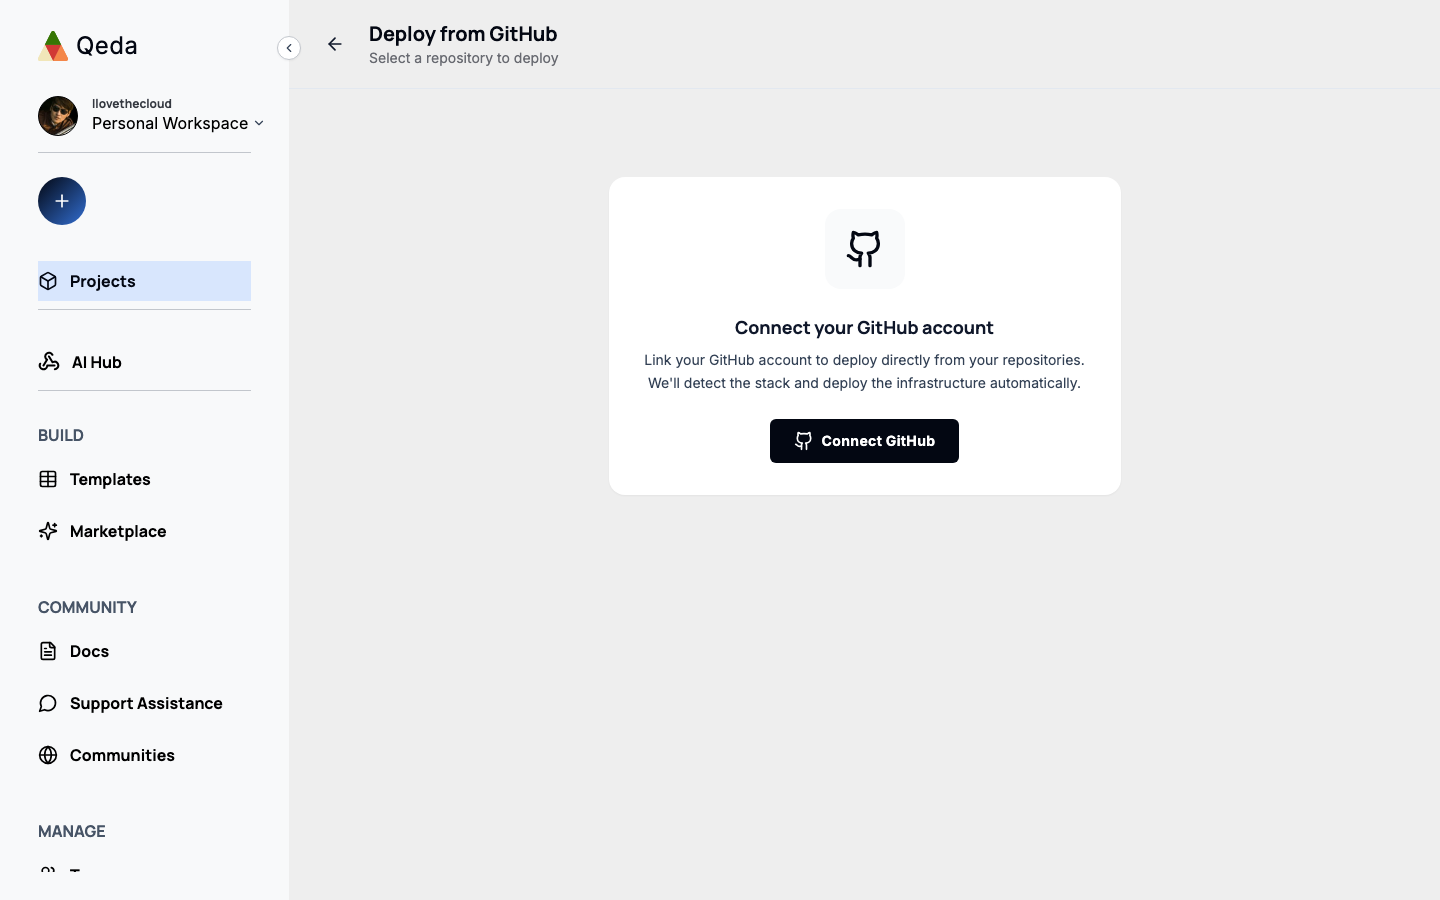
Selecting "GitHub | GitLab" first asks you to connect your GitHub account, if you haven't already — this only happens once per account, not once per project.
Once connected, you'll see a searchable list of your repositories — pick the one you want to deploy, and Qeda takes it from there.
Automatic stack detection
After you pick a repository, Qeda checks it for package.json, requirements.txt, a Dockerfile, and go.mod to figure out what it is — Node.js, Python, Go, Rust, Docker, or a static site.
Note. If detection succeeds, Qeda deploys immediately — no build command, start command, or port to fill in. That configuration screen only shows up if detection can't confidently tell what your project is; you can still adjust those values afterwards from the service panel.
Watching your first build
While it builds, you'll see the live status (queued, then building) alongside a real-time tail of the build logs — the same logs the platform is producing, not a simulated progress bar.
When it finishes, the "Deployed!" screen shows the image reference and how long the build took, plus the detected runtime. From there, "View Project" takes you back to the project page, where your new service now appears alongside its live status.